When people talk about Life Cycle Assessments (LCAs), they usually picture physical things: a plastic bottle, an electric vehicle, or a carton of milk. You trace the raw materials back to the earth, measure the manufacturing emissions, account for the shipping cardboard, and figure out how it’s recycled or landfilled.
But what if your "product" isn't something you can grab with your hands? What if you sell cloud software, logistics, financial planning, consultancy, or hospital operations?
In today's decarbonizing economy, Service LCAs are gaining rapid momentum. Service providers are feeling the heat from enterprise clients who need to report accurate Scope 3 emissions. Fortunately, mapping the environmental footprint of a service is highly achievable, and it becomes remarkably scalable once you establish the right structural framework.
In this post, we’ll explore what makes service LCAs different, how to conceptually structure them like an expert, and how you can use modular building blocks to model complex service networks efficiently.
What is a Service LCA, and how is it different?
At its core, a service LCA follows the exact same ISO 14040/44 principles as a product LCA. You are still assessing inputs, processes, and outputs. However, the nature of those inputs can be different. There are three considerations to keep in mind, that will make your journey easier.
1. Functional Units are always functional
In a product LCA, we are used to seeing functional units like one 500 ml beverage bottle or one m2 of flooring. This sometimes confuses people, as they think services cannot be measured in physical units.
However, ISO specifies that a Functional Unit should measure the function of a product, i.e. its output. For physical products, we often define functional units based on physical properties (e.g. m2 of flooring) when that is the primary metric of utility. But not always: in a photo camera, we are encouraged to measure it as 2000 photos taken or similar.
In service LCA, we need to go back to first principles, and focus on what the service provides. Functional units are defined by activity, time, or value. For example:
- SaaS Company: One active user account per year or 10,000 database queries.
- Logistics Provider: 1 tonne-kilometer (tkm) of cargo delivered.
- Consultancy: One hour of professional advisory services or one completed project audit.
2. Inventories are made of Operational Activities
A core step of an LCA of a physical product is the compilation of material requirements, typically in the form of a Bill of Materials (BOM) full of steel, plastic, and cardboard. This sometimes confuses people, as services are composed of activities rather than resources.
However, ISO specifies that an LCA must compile the inputs and outputs required to provide the functional unit. Therefore, a service LCA must compile an inventory of operational resources. Your inputs generally include:
- Digital Infrastructure: Server energy consumption, cloud hosting region grid mixes, and data transmission.
- Human Capital: Employee commuting, business travel, office space energy (HVAC, lighting), and remote work allowances.
- Capital Goods: The lifespan and manufacturing footprint of laptops, office furniture, or data center hardware allocated to the service.
3. Emissions are there, but they are indirect
People often associate LCA with emissions. They therefore think that, if their facilities don’t emit, they cannot do an LCA. However, most LCAs show that the biggest fraction of emissions (and impacts) come from the materials and energy consumed. So most emissions happen in your supply chain, not on your facilities.
Services also consume resources and energy, and as such their footprint is almost entirely composed of indirect emissions, often in your suppliers (Scope 3). Service companies have a supply chain just as much as manufacturers, and impacts generally come from there: the electricity grids used by your cloud providers, the flights your team takes, and the purchasing of office equipment.
Some people see their Scope 3 as an accounting burden, but it’s more helpful to see it as a procurement lever. Knowing the impact of those indirect emissions, you gain the visibility to make strategic decisions such as favoring cloud providers with cleaner grids or vendors with more efficient logistics.
How to do a service LCA
Unlike a physical product with a visible bill of materials, a service is intangible. However, the ISO 14040 and 14044 standards apply just as cleanly to services as they do to traditional manufacturing by building an authentic model of your activities and systematically quantifying the inputs and outputs required to deliver them.
Phase 1: Goal and Scope definition
Under ISO 14040, you must clearly define what is included in your study, and which rules you’re going to use to assess them. This also includes rules about how you will measure, allocate, select data, etc. If you are following a given standard, much of this will be described for you. If you aren’t, you must outline those rules so that your LCA is transparent.
As we saw in the previous section, defining a good Functional Unit is core in service LCA. Those should be based on your specific business model, e.g. one year of software access for an enterprise client or the execution of a single consulting project
You will also have to define your System Boundary by deciding what is relevant to include (like office overhead or corporate travel) based on your goals and data availability. This is also where you set Allocation Rules to partition shared impacts. For example: if your cloud server hosts both your Basic and Enterprise service plans, how do you decide which plan to assign the servers’ emissions, and how much? Allocation rules are simply the mathematical fair-share agreements you set to solve this.
Phase 2: Life Cycle Inventory
This is the stage where you gather all the data, based on the rules from Phase 1, and allocate it to the service or services you are assessing. Complex product systems are often broken down into unit processes to make them manageable.
Instead of a physical bill of materials, your data collection maps out the physical and service inputs required to deliver the service, such as electricity consumed by office buildings and data infrastructure, transport distances from corporate travel or logistics, and the life cycle of assets like laptops and servers.
You can think of these unit processes as modular building blocks—like modeling one hour of standard office overhead, a standard repair task, or a specific shipping route separately before combining them. In practice, these activities are meant to make your data management easier and clearer. The goal here is simply to compile a clean, activity-based operational inventory of what your service consumes.
Phase 3: Life Cycle Impact Assessment (LCIA)
In this phase, you translate the compiled inventory data into actual environmental impacts. This typically means taking your activity data (like kWh of electricity from servers or kilometers of travel) and using verified background databases (like ecoinvent) to calculate the associated emissions. These emissions are then used to calculate the environmental impact. A very common one is Global Warming Potential, but you can use those same associated emissions to calculate impact on Water Use, Ecosystems Quality, etc.
This is no different in service LCA as it is on the LCA of physical products.
Phase 4: Life Cycle Interpretation
The final phase of ISO 14040 is where you evaluate the robustness of your findings and translate them into decisions. You may also identify hotspots, specific business activities or supply chain elements driving the majority of your service's footprint.
In services in particular, this step is crucial for evaluating data quality, testing your allocation assumptions, and identifying areas where generic background data or spend-based proxies can be targeted and replaced with primary data to refine the accuracy of the assessment. When some data is relevant and dubious, you often perform sensitivity analysis: you test how the results would look different if you would have chosen differently.
Service LCAs at Scale: Reusing Building Blocks with Earthster
In practice, a service is rarely a flat entity; it is a network of interconnected operational activities. If you are trying to map a complex logistics network or an IT consultancy with multiple regional offices and data configurations, building each final customer offering from scratch is impossible.
Managing these nested dependencies manually in a spreadsheet is possible, but it quickly becomes a fragile, error-prone task as your business scales. Earthster’s Generator handles this complexity by directly embedding the official ISO 14040 phases into a scalable, automated system. It allows you to model every single individual business activity—the foundational building blocks—and layer them dynamically until you reach the final product or service delivered to the customer.
Phase 1: Your goal and scope in terms of building blocks
During this first phase, you establish your study’s system boundaries by defining which specific business activities need to be constructed as independent building blocks. Instead of viewing a service as a single monolith, you break it down into modular parts: individual transport routes, localized hourly office overheads, hardware repair tasks, or server infrastructure configurations.
When doing so, you will be setting up your allocation rules. If you have overhead activities, you will have to define what their baseline is, i.e. what the functional unit for that process is. For example, if you have some impacts associated with Human Resources, you might want to allocate them per hour of work. By doing this, you are deciding exactly how shared corporate infrastructure or multi-tenant server environments will be divided among your services before any data is collected, ensuring a consistent framework across all operations.
Phase 2: Inventory as activity data gathering
The Inventory phase is where you gather your raw operational data and map out how your business activities connect. Instead of performing manual, repetitive data entry for every customer account, you compile your data directly from your ERP or project management software into two distinct, flat tables.
First, you define your base models, i.e. the standalone operational building blocks. You document the raw inputs required to execute a single unit of that specific activity (e.g. a single route delivery or a server hosting hour).
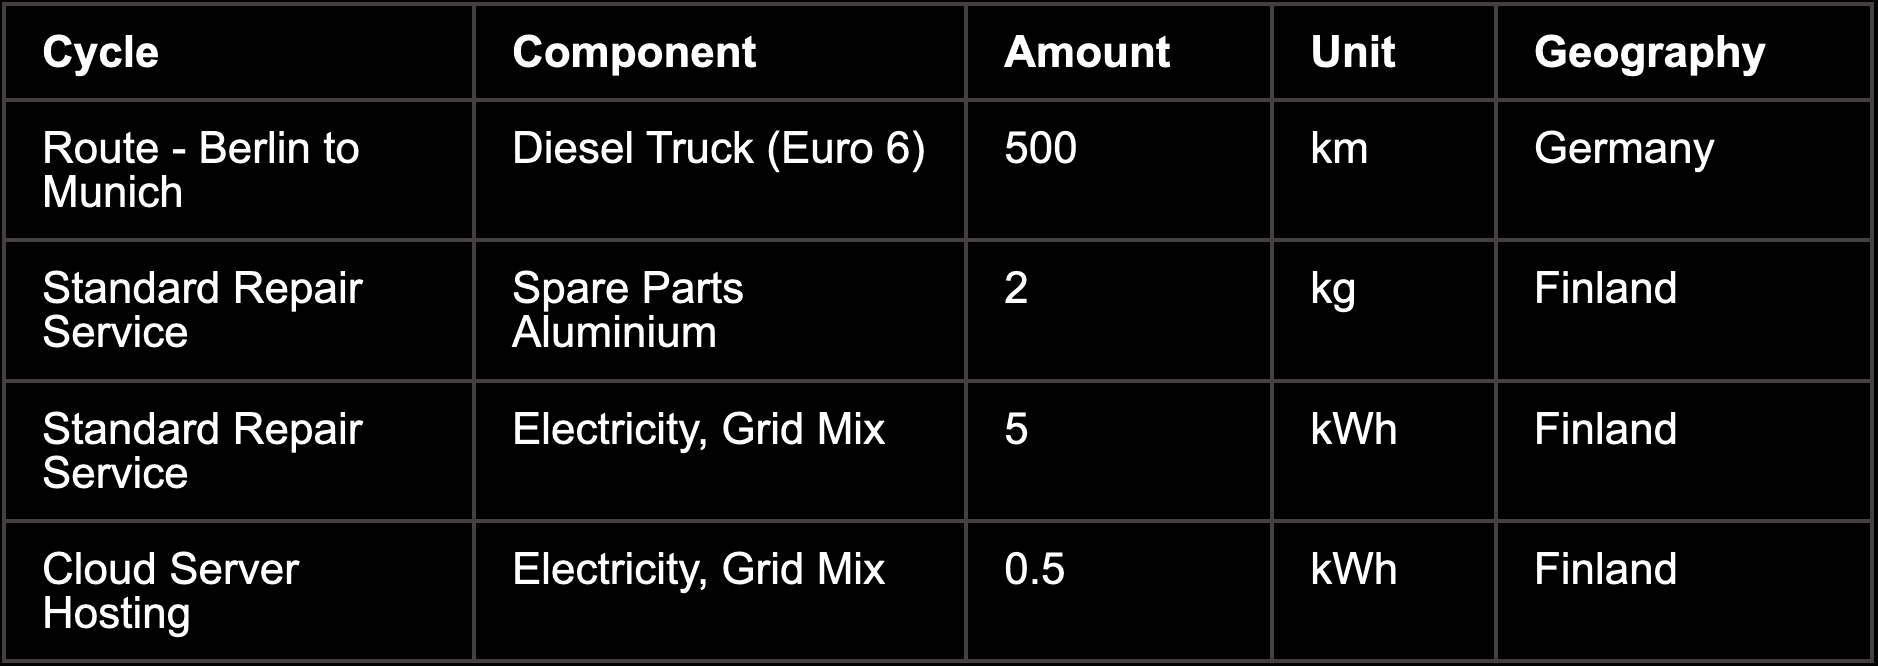
This table acts as your Sustainability Library. By defining these foundational building blocks once, you ensure that any future updates to them automatically reflect in every service package using them. The data can be loaded directly into Earthster, and they will be available for any future models you build… or data you upload!
Second, you define the actual service execution, i.e. how a particular customer package consumes those pre-defined background building blocks, alongside any other direct foreground inputs like travel or office time. Earthster uses smart name-matching to automatically link the two tables together, accommodating as many nested layers as your operational reality requires.

This table illustrates your service logic. It dynamically references your base models above. Efficiency improvements of any single building block automatically ripple through to this service description, keeping your carbon calculation live and accurate.
Phase 3: Life Cycle Impact Assessment (Loading to Earthster)
The Impact Assessment phase is where Earthster takes over the heavy lifting. Once you upload your spreadsheet inventory into the platform, the Generator processes all data simultaneously, and immediately calculates all impacts.
It automatically translates your raw business activities into environmental metrics. For the base models, you will map them to international background databases (like ecoinvent), but for your foreground models, the mapping will happen automatically! Since you have already generated all those base models, that represent your corporate reality, the system is clever enough to do those mappings… and to calculate your impacts.
But don’t mistake speed with simplicity. Earthster instantly calculates the life cycle impacts across all nested levels, compiling the emissions (such as CO2e) for every underlying building block and the final product packages automatically. You have provided it with rich data about your business and your services; the system just does what computers do best, and automates the repeatable tasks.
Phase 4: Real-time interpretation and feedback loops
Interpretation is where Earthster's interface transforms how you interact with LCA data. Rather than handing you a static, retrospective report, the platform visually guides you through the results, allowing you to iterate and understand your environmental impacts in real time.
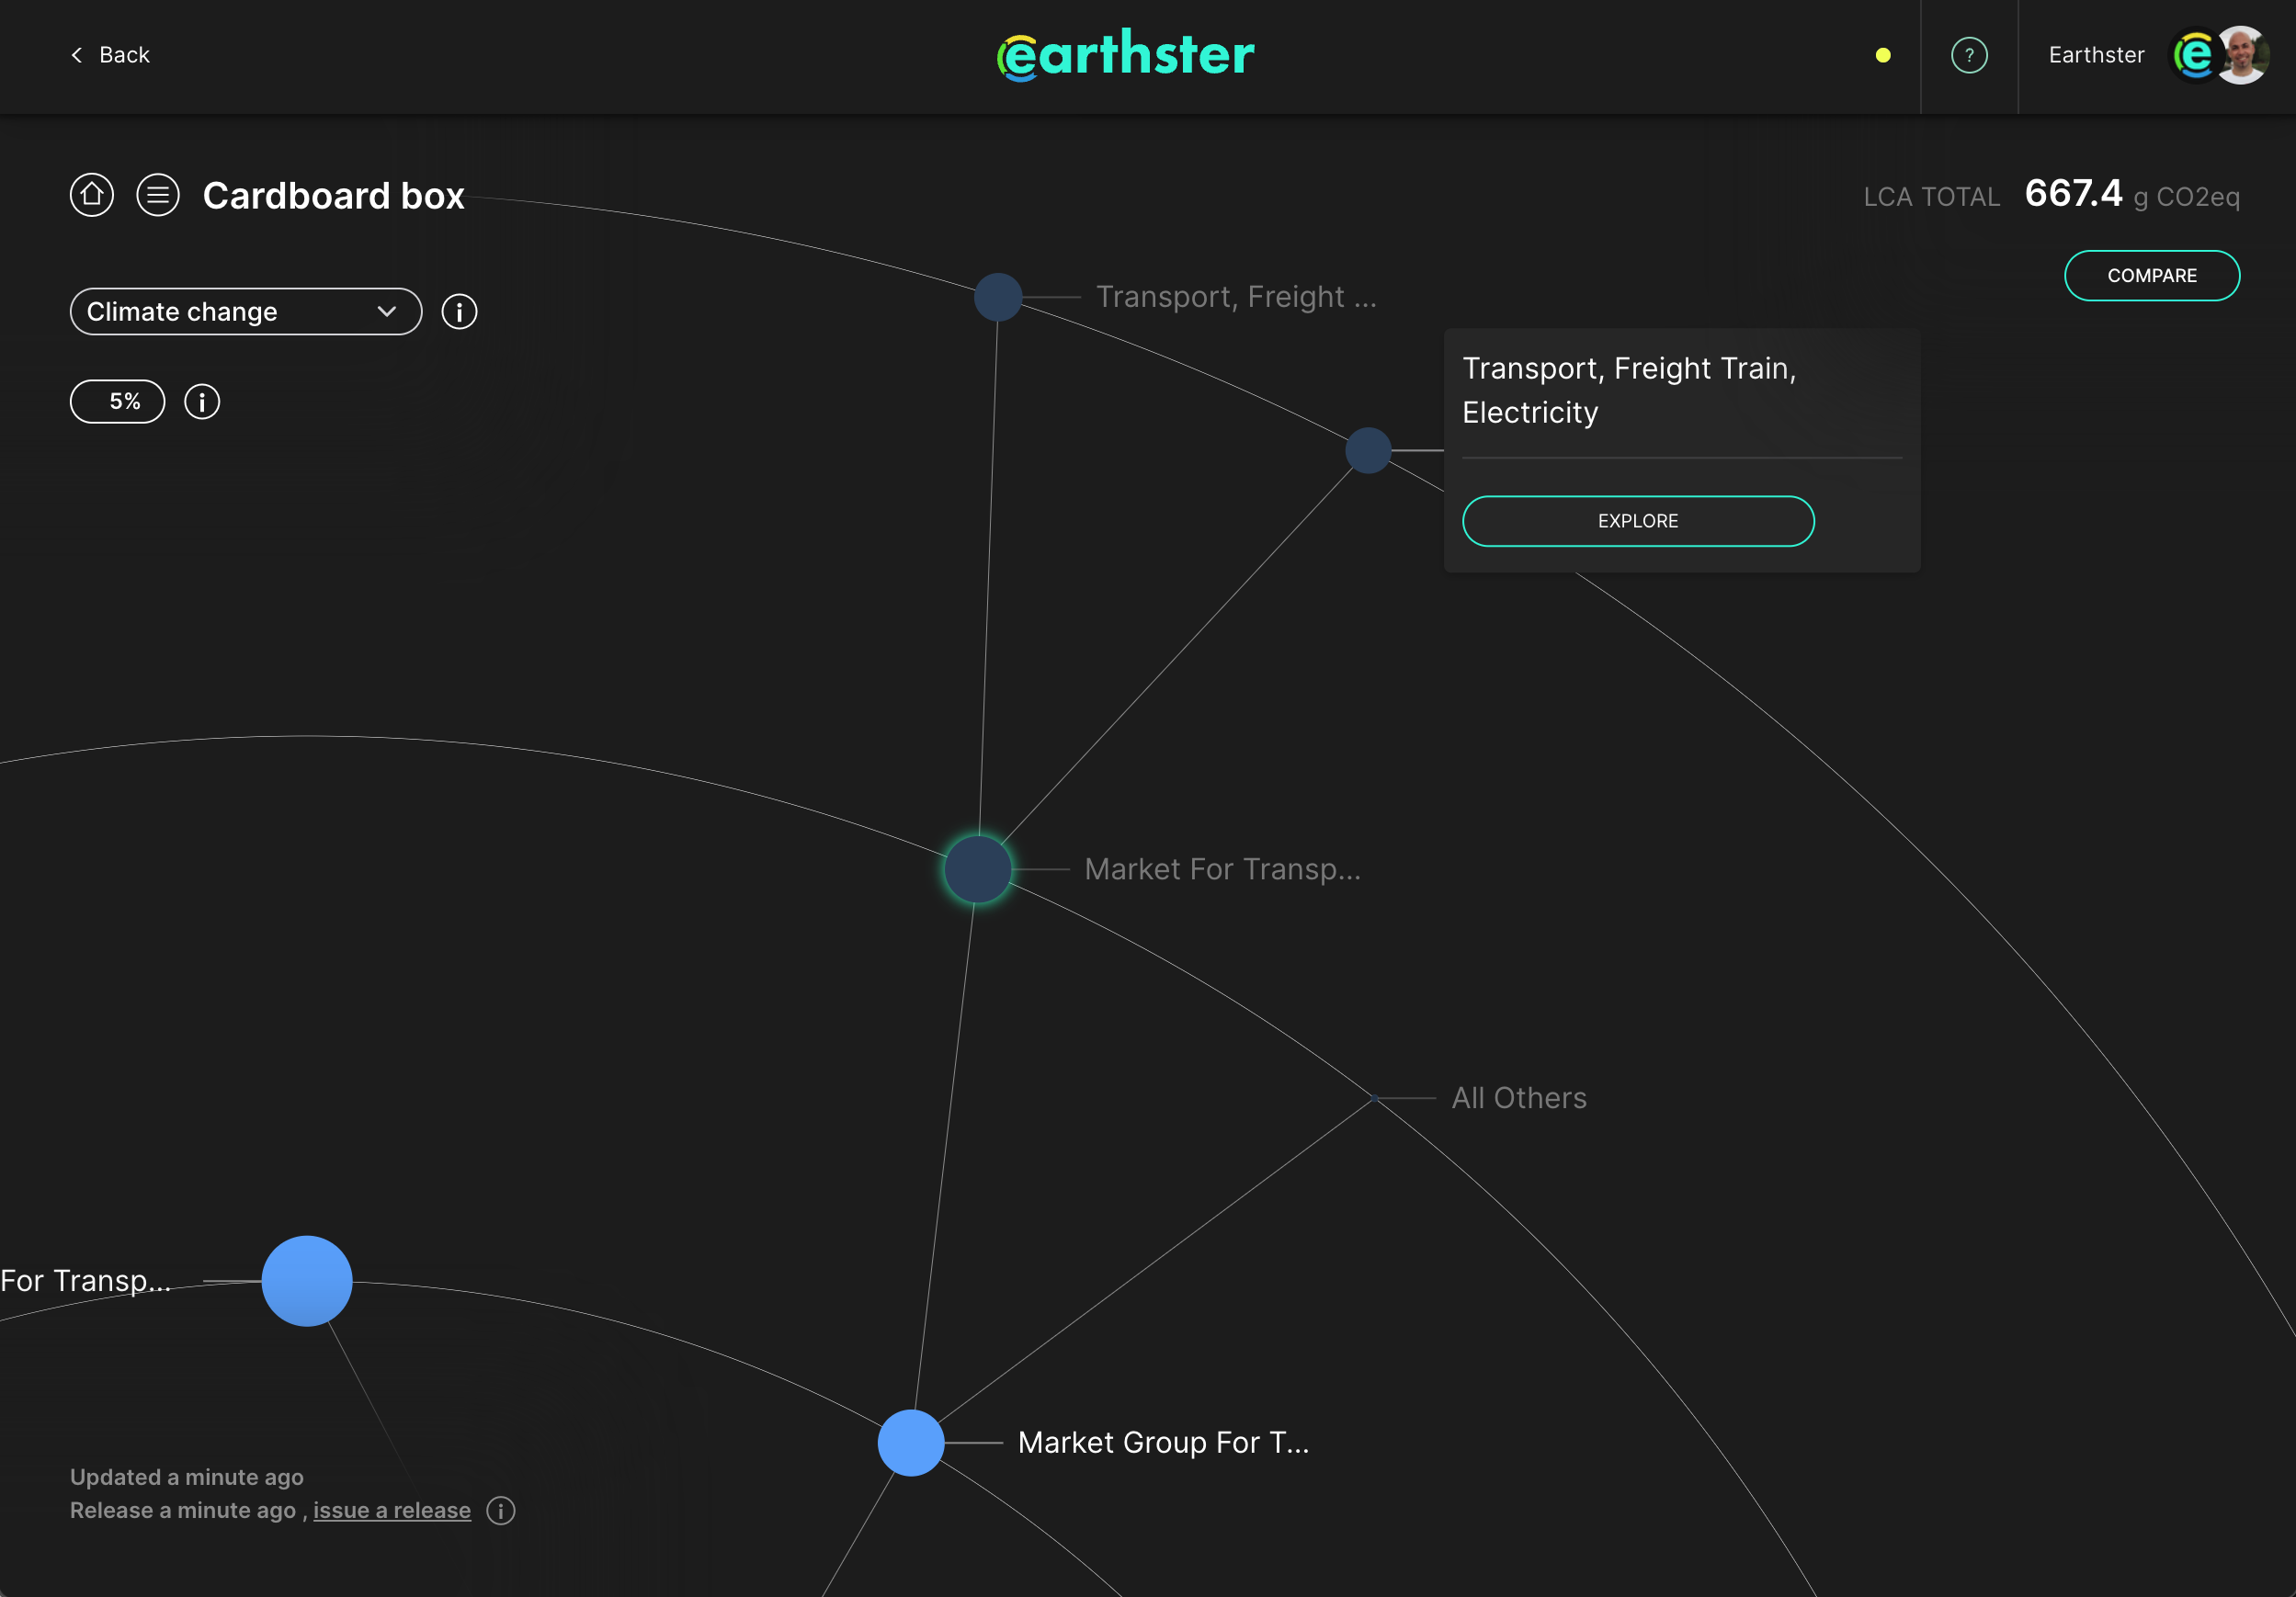
Because you can explore the results quickly and interactively, you can catch data gaps, test sensitivities, and drastically modify your assumptions on the fly. For instance, you can run an instant sensitivity analysis on your allocation rules to see if dividing shared corporate overhead by head-count versus revenue actually alters your final conclusions.
Because background data in service LCAs can be less precise, your initial results might highlight a major carbon hotspot that relies entirely on conservative proxy data. A common culprit is the use of spend-based Input-Output (IO) data for abstract line items like advertising, legal services, or digital tools. If Earthster shows that a questionable generic proxy represents a meaningful percentage of your impact—say, 60% of your service footprint—you can interrogate that hotspot visually and refine it immediately.
You simply click into that specific underlying business activity and swap the generic data for primary data, such as uploading actual utility bills or using precise regional electricity grid mixes rather than national averages. Because the architecture is nested, this refinement instantly cascades upward through every single route, project run, and final customer product that references it, giving you an accurate, living model of your carbon footprint.
Leverage Service LCAs for Competitive Advantage
Measuring service impacts at such a scale is a powerful business tool. Providing transparent environmental data helps you:
- Deliver Customer-Specific Footprints: Share customized carbon footprint reports (CO2e) with your clients to help them easily calculate their Scope 3 emissions.
- Optimize Internal Operations: Identify exactly which service lines, travel routes, or server regions are driving your emissions so you can make data-driven reduction plans.
- Win More RFPs: Modern procurement departments actively score service providers on their environmental metrics. Standing out with precise, verifiable, ISO-compliant LCA data gives you an immediate competitive edge.
Whether you are delivering software, shipping physical cargo, or providing expert consulting, your service has a footprint—and a story to tell. Are you ready to explore and share your footprint? Book a meeting with Earthster to see our portfolio generator in action and learn how to scale your LCA modeling.